Hey there! So you’ve probably seen those news headlines like “Candidate A leads by 3 points, margin of error ±3%.” And maybe you thought, “Cool, sounds pretty close!” Well, buckle up, because I’m about to blow your mind with some statistical truth bombs.
Here’s the deal: that margin of error number everyone throws around? It’s basically the range of uncertainty when we’re estimating stuff from a sample instead of asking literally everyone. Think of it like a “give or take” zone that tells us how much our numbers might bounce around.
But here’s the kicker—and this is where it gets wild—the actual survey error is usually about twice as large as what they report. Yep, you read that right. That cozy little ±3% margin? In reality, you’re looking at closer to 6-7 points of wiggle room. Mind. Blown.
So why does this matter? Well, if you’re making decisions based on polls, surveys, or A/B tests (hello, fellow data nerds and business folks!), you need to understand what’s really going on under the hood. We’re going to dive into something called Total Survey Error (TSE), which is basically all the messy real-world stuff that makes surveys less perfect than the math suggests.
And don’t worry—I’m going to break all this down in a way that actually makes sense, with real formulas you can use, examples that don’t make your eyes glaze over, and some genuinely useful tips for interpreting data in the wild. By the end of this, you’ll be that person at parties who can explain why election polls sometimes get it so wrong (okay, maybe save this for the right kind of party).
- Foundational Statistics: Let's Break Down the Traditional Margin of Error
- The Total Survey Error: Why Your Margin of Error Is Bigger Than You Think
- Advanced Interpretation: Actually Using This Stuff in Real Life
- Wrapping It Up: Get Real About Uncertainty
Foundational Statistics: Let’s Break Down the Traditional Margin of Error
Alright, before we get into the juicy stuff about why everything’s more uncertain than it seems, we need to nail down the basics. I promise to keep this as painless as possible!
Calculating the Standard Margin of Error (The Basic Version)
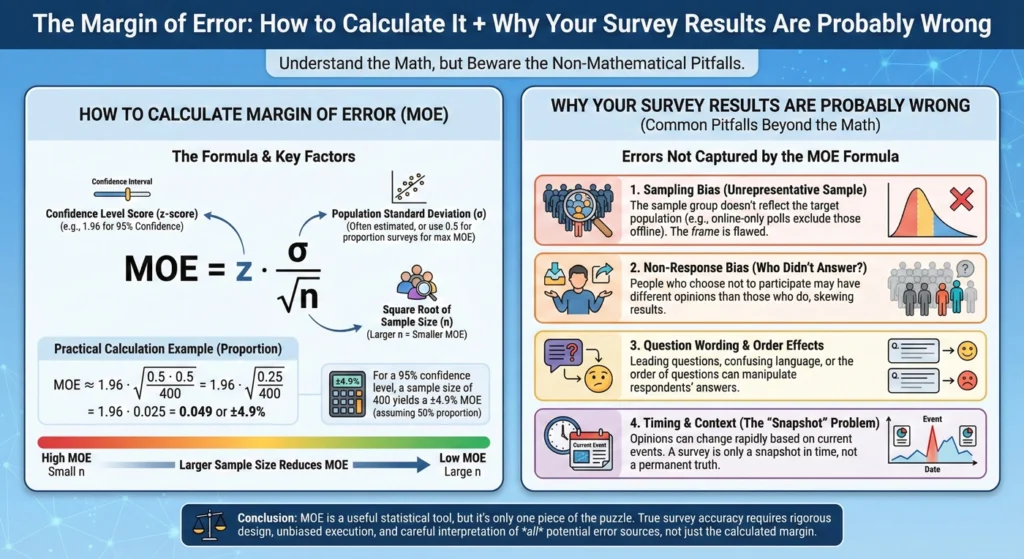
So, how to find margin of error in its simplest form? Here’s the classic formula that pollsters use:
ME = Z × √[p(1-p)/n]
I know, I know—math formulas can be scary. But stick with me! Here’s what each piece means:
- Z-score (Confidence Level): This is basically how sure you want to be. For 95% confidence (which is the standard), Z = 1.96. Think of it like saying, “I want to be right 95 out of 100 times.”
- p (Sample Proportion): This is the percentage you’re measuring. Like, if 52% of people in your survey prefer chocolate ice cream, p = 0.52.
- n (Sample Size): How many people you asked. Simple enough, right?
Now, here’s a pro tip: this margin of error formula spits out the radius of what we call a confidence interval. Basically, if your survey says 52% of people like chocolate ice cream with a margin of error of ±3%, the actual number is probably somewhere between 49% and 55%. We’re creating a little safety net around our estimate.
And here’s something cool: the margin of error is really just the standard error (which measures how much your sample results bounce around) multiplied by that Z-score we talked about. The standard error is all about the natural fluctuation you get from sampling, and then we multiply it by our confidence level to get the full margin of error.
What Actually Drives the Margin of Error?
Three main things make your margin of error bigger or smaller:
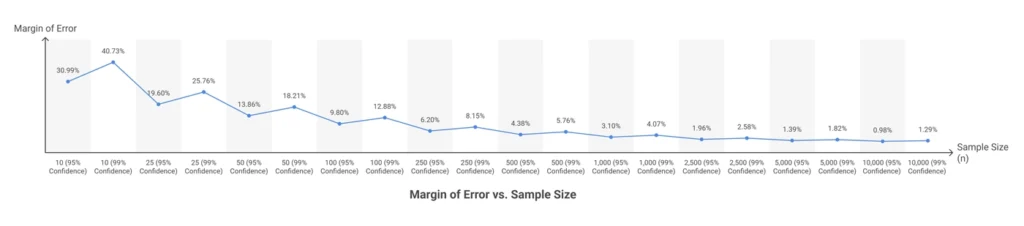
1. Sample Size (n)—The Big Kahuna
This is the heavyweight champion of MOE factors. Naturally, a smaller margin of error requires asking more people! However, here’s the catch—there are seriously diminishing returns here. To cut your margin of error in half, you need to quadruple your sample size. Yeah, ouch. That’s why those margin of error calculator tools always show that sweet spot where adding more respondents stops being worth the cost.
2. Confidence Level—How Sure Do You Wanna Be?
So, you want to be 99% confident instead of 95%? Cool, but your margin of error just got bigger. It’s like asking for extra insurance—you get more certainty, but it costs you (in this case, a wider range of possible answers).
3. Population Variability (p)—The 50/50 Effect
Here’s something weird: your margin of error is biggest when things are most uncertain—like when 50% of people say yes and 50% say no. Interestingly, when proportions get more extreme (like 90% vs. 10%), the margin actually shrinks. Kinda counterintuitive, right?
The Total Survey Error: Why Your Margin of Error Is Bigger Than You Think

Okay, now we’re getting to the good stuff. Everything I just explained? That’s only accounting for random sampling variation. It’s like… imagine you’re trying to measure how tall people are, but your measuring tape is perfect and everyone stands totally straight. That’s what the basic margin of error assumes.
But real life? Real life is messy.
All the Ways Surveys Get Messy (Non-Sampling Errors)
The traditional margin of error completely ignores these four troublemakers:
1. Frame Error—Starting with the Wrong List
This is when your list of people to survey doesn’t actually match who you’re trying to study. Classic example: trying to predict election results but not knowing who’s actually going to show up to vote. Your sampling frame (registered voters) might be way different from your target population (actual voters). Whoops.
Real example: In the 2016 Brexit vote, pollsters sampled from lists of “likely voters” based on regular election turnout patterns. But Brexit brought out a completely different crowd—older voters in post-industrial towns who usually skip elections showed up in droves, while younger people who promised they’d vote… didn’t. The pollsters were talking to the wrong people the entire time.
2. Nonresponse Error—When Certain People Ghost You
Here’s a fun one: what if supporters of the losing candidate are just… less likely to answer your calls? Or what if younger people never pick up for unknown numbers? (Spoiler: they totally don’t.) If the people who don’t respond are systematically different from those who do, you’ve got bias baked right into your results.
Real example: In Brexit polling, Leave supporters were systematically less likely to participate in polls—partly because they distrusted “elite” institutions like polling companies, and partly because they lived in harder-to-reach areas (rural, landline-only households, older demographics). The pollsters had no idea they were missing an entire voting bloc.
3. Measurement Error—Your Questions Might Suck
Sorry, but it’s true! How you word a question massively affects the answer. Plus, there’s interviewer bias (people want to please the person asking questions) and social desirability bias (people lying to look good). Try asking someone if they’re racist versus if they have unconscious biases—you’ll get very different responses.
Real example: Some Brexit Leave voters were embarrassed to admit their position to pollsters (worried about sounding racist or xenophobic because of the immigration focus), so they said “Remain” on the phone but voted Leave in the privacy of the ballot box. Social desirability bias in action!
4. Specification Error—Lost in Translation
Sometimes people just… misunderstand the question. Like, if you ask about “income,” does that mean before or after taxes? Per person or household? These little misunderstandings add up.
Real example: Brexit pollsters used “likely voter” models from regular elections to predict turnout. But asking “Did you vote in the last general election?” was the WRONG question. They should have been measuring “How emotionally invested are you in this specific issue?” Brexit mobilized a different electorate entirely—their turnout predictions were based on irrelevant historical data.
The Cold, Hard Truth: Real Survey Error Is About 2X Bigger
Alright, here’s where I drop the bombshell I promised. Researchers did the math by comparing pre-election polls to actual election results (the ultimate fact-check), and guess what they found?
The average difference between polls and reality was about 3.5 percentage points—roughly twice what the reported confidence intervals suggested. So that ±3% margin of error in the news? Yeah, the real-world margin is more like ±6-7%.
But wait, it gets worse!
📊 CASE STUDY: How Brexit Polls Got It Spectacularly Wrong (2016)
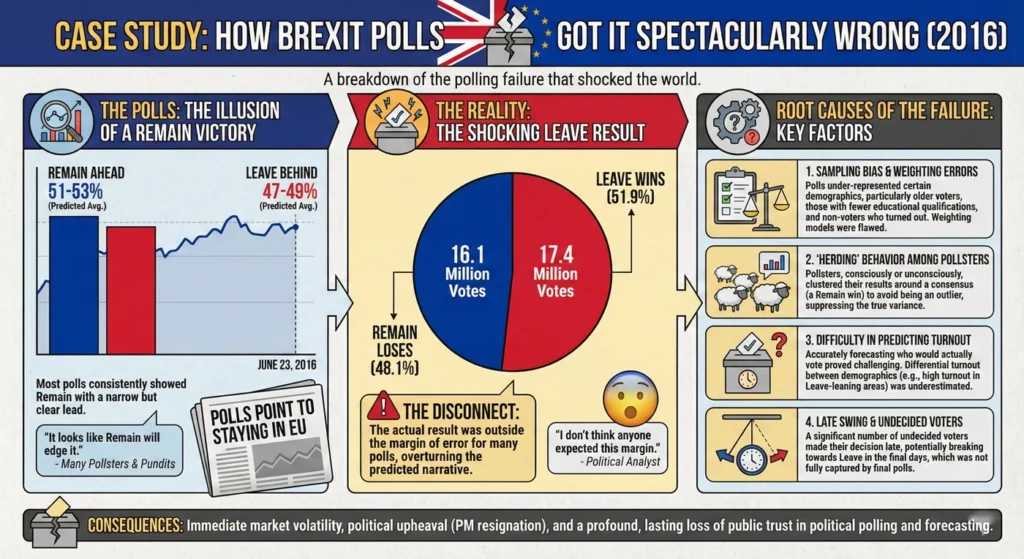
Want to see this “2X bigger” thing in action? Let me tell you about the time British pollsters completely botched the Brexit vote—and I mean COMPLETELY.
What Everyone Thought Would Happen
In June 2016, the United Kingdom held a referendum: should Britain leave the European Union or remain? Every major polling organization predicted the same outcome.
Final Poll Predictions:
- Britain would vote to Remain in the EU
- Lead: 2-4 percentage points for Remain
- Reported margin of error: ±3% (pretty standard)
- Sample sizes: Massive! Between 1,000 and 5,000 respondents per poll
The Math Looked Perfect:
- YouGov’s final poll: 4,772 respondents → MOE of ±1.4%
- Ipsos MORI poll: 1,592 respondents → MOE of ±2.5%
- Average across all polls: ±3%
Everyone felt confident. Although the margins were tight, Remain was ahead, and the math said the polls were solid.
What Actually Happened
June 23, 2016 Results:
- Britain voted to Leave the EU
- Final tally: Leave 51.9%, Remain 48.1%
- Surprisingly, the polls weren’t just wrong—they were wrong in the opposite direction
The Damage:
- Average polling error: 6-8 percentage points
- That’s 2-3X the reported margin of error
- YouGov’s ±1.4% MOE? In reality, they were actually off by 3.8 points (2.7X their margin)
- Some telephone polls were off by 10+ points
Financial markets crashed. Additionally, the British pound dropped 10% overnight. The Prime Minister resigned. Meanwhile, the polling industry had to explain how they got it so spectacularly, systematically wrong.
The Forensic Autopsy: What Went Wrong?
Here’s where it gets fascinating. Remarkably, the pollsters did the MATH correctly. The margin of error calculations were textbook perfect. So what happened?
Error #1: Frame Error (Wrong People on the List)
Pollsters built their sampling frames from voter registration lists and used turnout models from previous general elections. Sounds reasonable, right?
Wrong. Specifically, Brexit mobilized a completely different electorate:
- Who the polls found: People who voted in the 2015 general election
- Who actually voted: Older, working-class voters in post-industrial regions who typically sit out normal elections but were FIRED UP about immigration and sovereignty
Consequently, the pollsters’ lists included these people, but their turnout models weighted them DOWN (assuming they wouldn’t show up) while weighting young people UP (assuming they would).
Reality flipped the script. Notably, older Leave voters turned out at 75%+ rates. Young Remain voters? Many stayed home despite telling pollsters they’d “definitely vote.”
Error #2: Nonresponse Bias (The Missing Voters)
Similarly, Leave supporters were systematically less likely to answer polls:
- More likely to live in rural areas (harder to reach)
- More likely to have landlines only (which younger, mobile-first pollsters struggled with)
- More likely to distrust “elite institutions” like polling companies and refuse to participate
One study estimated that Leave voters were 15-20% less likely to respond to polls than Remain voters—even after controlling for age, education, and location. Unfortunately, you can’t weight for people who won’t talk to you.
Error #3: Measurement Error (Lying to Look Good)
Social desirability bias hit hard. The Leave campaign was heavily focused on immigration control, and consequently, many voters worried about being perceived as racist or xenophobic.
The Evidence:
- Online polls (anonymous): Leave performed 2-3 points better
- Telephone polls (human interviewer): Remain performed 2-3 points better
That 4-6 point swing? Classic social desirability bias. Essentially, people told the nice pollster on the phone what they thought sounded good, then voted their true preference in private.
Interestingly, some pollsters later found that when they asked, “Who do you think your NEIGHBORS will vote for?” they got much more accurate Leave numbers. People projected their real views onto others to avoid admitting them directly.
Error #4: Specification Error (Measuring the Wrong Thing)
The killer mistake was the question pollsters asked to build their turnout models: “Did you vote in the last general election?”
Why this was wrong:
- General elections are about parties, leaders, and diverse policy issues
- In contrast, Brexit was a single, emotionally charged, binary question about national identity
- Therefore, the people who cared enough to vote in 2016’s referendum were NOT the same as the people who voted in 2015’s general election
Pollsters specified their models using irrelevant historical data. Essentially, they asked “Who usually votes?” when they should have asked “Who cares intensely about THIS specific issue?”
Error #5: Herding (The Groupthink Problem)
Here’s a dirty secret: in the final week before the vote, several polling firms that had previously shown Leave leads suddenly “adjusted” their methodologies and flipped to predicting Remain victories.
Why? They didn’t want to be the outlier. As a result, being wrong alone looks worse than being wrong together.
This created a false consensus. When all the polls converge on the same answer despite using different methods, it doesn’t mean they’re triangulating on truth—rather, it means they’re all scared of being the lone wolf who’s wrong.
The Numbers: Perfect Math, Wrong Answer
Let’s zoom in on YouGov’s final poll because it perfectly illustrates the point.
YouGov’s Numbers:
- Sample size: 4,772 people (huge!)
- Result: Remain 52%, Leave 48%
- Calculated MOE: ±1.4% (using the formula perfectly)
- Confidence level: 95%
The Math Says: “We’re 95% confident the true value is between 50.6% and 53.4% for Remain.”
Reality: Leave won with 51.9% (Remain got 48.1%)
The Error: 3.8 percentage points—nearly 3X their reported margin of error
This is the perfect example of precision without accuracy:
- ✅ Math: Correct
- ✅ Sample size: Large
- ✅ MOE calculation: Perfect
- ❌ Result: Completely wrong
Ultimately, all those non-sampling errors (frame, nonresponse, measurement, specification) stacked up in the same direction and overwhelmed the small sampling error captured by the margin of error.
What the Polling Industry Learned (The Hard Way)
Lesson 1: Big Sample ≠ Right Answer
YouGov surveyed 4,772 people. Similarly, the Literary Digest famously surveyed 2.4 MILLION people in 1936 and still got the presidential election catastrophically wrong. Size doesn’t fix systematic bias.
Lesson 2: Turnout Modeling Is Make-or-Break
After Brexit, pollsters realized they needed to:
- Stop using general election turnout as a proxy for referendums
- Instead, measure emotional intensity and issue salience, not just demographic characteristics
- Accept that high-stakes binary choices bring out different voters than normal elections
Lesson 3: The “Shy Voter” Is Real
When social stigma attaches to a position (whether it’s voting Leave, Trump, or anything controversial), expect measurement error. People lie to pollsters to avoid judgment. Consequently, online and anonymous surveys perform better in these scenarios.
Lesson 4: Trust in Institutions Matters
When distrust of “elites” becomes correlated with vote choice, and the polling industry is seen as part of that elite establishment, you get differential nonresponse you can’t fix with demographics alone.
Importantly, this wasn’t unique to Brexit—the same dynamics showed up in the 2016 and 2020 U.S. elections.
The Brutal Bottom Line
The Brexit polling failure is Exhibit A for why the traditional margin of error is incomplete. Every poll reported ±3% margins. Every poll did the math correctly. Nevertheless, every poll was wrong by 2-3X that amount.
Why? Because the margin of error only measures random sampling variation—it assumes everything else is perfect. However, in Brexit:
- The sampling frame was biased (Frame Error)
- The respondents were unrepresentative (Nonresponse Error)
- The answers were dishonest (Measurement Error)
- The turnout model was wrong (Specification Error)
- The pollsters copied each other (Herding/Processing Error)
That’s Total Survey Error in action. Furthermore, it’s why that ±3% you see in polls is really more like ±6-8% in the real world.
The Correlated Bias Problem
Election polls don’t just have random errors—they have systematic bias that averages 1-2 percentage points depending on the race. Moreover, here’s the kicker: because most polling organizations use similar methods (similar likely voter models, similar weighting techniques), their errors are correlated.
What does that mean in English? Essentially, if one poll is off, they’re probably all off in the same direction. Averaging multiple polls doesn’t necessarily make things better—it’s like asking ten people who all learned from the same wrong textbook. Consequently, they’ll all give you the same wrong answer!
We saw this perfectly with Brexit. The final polls showed:
- YouGov: Remain +4
- Ipsos MORI: Remain +8
- Survation: Remain +1
- Average: Remain +4
They all predicted Remain would win. However, they were all wrong in the same direction. Averaging them together didn’t help because they all suffered from the same systematic biases.
Design Effects—Making Things Even More Complicated
Professional pollsters use fancy weighting procedures to make sure their samples look like the actual population (adjusting for age, race, education, etc.). This is called “raking” in the biz. While it’s super important for accuracy, it has a side effect: it makes the margin of error larger than the simple formula suggests.
This is called the “design effect,” and unfortunately, a lot of pollsters just… don’t mention it when they report their margin of error. Therefore, they’re claiming more precision than they actually have. Sneaky!
In the Brexit polls, for instance, some organizations applied design effects that increased their true margin of error by 30-50%. However, you wouldn’t know it from reading the headlines.
Advanced Interpretation: Actually Using This Stuff in Real Life

Okay, enough theory. Let’s talk about how to actually use margin of error knowledge when you’re trying to figure out if poll results mean anything.
When Is a Lead Actually Real? (Statistical Significance 101)
Here’s a mistake I see constantly: People think if Candidate A is leading Candidate B by more than the margin of error, that’s a real lead. NOPE!
The Real Rule: Calculate the Margin of Error for the Difference
When you’re comparing two numbers (like two candidates’ support levels), you need to calculate a new margin of error for the difference between them. Furthermore, it’s bigger—usually about 1.4 times the individual margin of error (the square root of 2, for you math folks).
Real-World Example Time
Let’s say:
- Candidate A: 48% support
- Candidate B: 43% support
- Lead: 5 points
- Reported margin of error: ±3%
Most people would say, “Cool, A is winning!” However, hold up. The margin of error for the difference is about ±4.2% (1.4 × 3%). Additionally, some polls simplify and say it’s roughly twice the individual MOE, so ±6%.
That 5-point lead? It’s well within the margin of error for the difference. Therefore, this race is a statistical tie, folks! Either candidate could actually be ahead.
And if we apply the Brexit lesson? Remember, real-world error is about 2X the reported MOE. Consequently, that ±3% is really ±6%, and the MOE for the difference is ±8-12%. Now that 5-point lead looks like pure noise.
Tracking Real Change Over Time (Or Just Noise?)
So you see a new poll showing your favorite candidate up 3 points from last week. Time to celebrate? Probably not.
Comparing Two Polls = Even Bigger Margin of Error
When you’re looking at change between two different polls, you’re combining the uncertainty from both surveys. Consequently, that margin of error can balloon to ±8 points or more for detecting a meaningful shift.
Trust Trends, Not Single Data Points
Want to know what’s really happening? Don’t obsess over one or two polls. Instead, look at the trend line across multiple surveys over time. If five different polls all show movement in the same direction, you’re probably seeing something real. However, one poll showing a bounce? Could just be noise.
This is exactly where the Brexit polls led everyone astray. Initially, people looked at individual polls showing Remain ahead and thought, “Okay, Remain’s winning.” However, if they’d looked at the trend—the fact that Leave was consistently outperforming in online vs telephone polls, that undecideds were breaking late, that turnout models showed concerning patterns—they might have seen the warning signs.
Subgroups Are Even Trickier
Furthermore, here’s something that really exasperates me: when news outlets break down poll results by subgroup (like “among Hispanic voters” or “among young people”). Those subgroups have way fewer people in them, so consequently, their margin of error is much larger—think ±8% instead of ±3% for the overall sample.
Therefore, when you see “Candidate X leads by 6 points among young voters,” check if they’re reporting that subgroup’s margin of error. They usually aren’t!
Real-World Business Decisions (A/B Testing Edition)
This isn’t just for political junkies! If you’re running A/B tests for your website, email campaigns, or product features, margin of error is your best friend.
The Statistical Safety Net
Imagine you test two versions of your checkout page:
- Version A: 5% conversion rate
- Version B: 5.5% conversion rate
Looks like B wins, right? However, if your margin of error is ±1%, the true conversion rates could be anywhere from 4-6% for A and 4.5-6.5% for B. Consequently, there’s a ton of overlap there—you might just be seeing random chance!
Making Smart Business Calls
For most business decisions, an acceptable margin of error is between 1% and 5%, depending on what’s at stake. High-stakes changes (like completely redesigning your product) need tighter margins. In contrast, low-risk tweaks (like button colors) can tolerate more uncertainty.
The key question: Even if you account for the full range of the margin of error (the whole confidence interval), would the change still be worth implementing? If yes, go for it. However, if the worst-case scenario within your margin of error would be bad news, pump the brakes.
And remember: Just like Brexit, your A/B test has non-sampling errors too:
- Are you testing on representative users, or just your most engaged customers? (Frame Error)
- Did certain user types drop out of the test early? (Nonresponse Error)
- Are people behaving differently because they know they’re being tested? (Measurement Error)
Wrapping It Up: Get Real About Uncertainty
Look, here’s the bottom line: the margin of error is like the “statistical conscience” of survey research. Essentially, it’s that little voice reminding us, “Hey, this is just an estimate, not gospel truth.”
However, the traditional margin of error—the one you see reported in polls and surveys—is accounting for just one type of uncertainty: random sampling variation. It’s necessary, but incomplete.
The Real-World Reality Check
For any critical decision—whether you’re analyzing election polls, making business calls, or evaluating research findings—you need to think about Total Survey Error. Moreover, as a practical rule of thumb? Mentally double the reported margin of error to account for all those non-sampling errors we talked about.
That ±3% margin you keep seeing? Think of it as more like ±6%. That “statistically significant” A/B test result? Perhaps it’s not so significant after all.
The Brexit polls thought they had ±3% margins. Instead, they were wrong by 6-8 points. The 2016 U.S. election polls thought they had it figured out. They didn’t. Similarly, the 2020 polls “fixed” the problems from 2016 and were even MORE wrong.
Does This Mean Surveys Are Useless?
Absolutely not! They’re incredibly valuable tools. However, like any tool, you need to understand their limitations. A hammer is great, but you need to know it’s not the right tool for every job.
Therefore, next time you see a poll in the news, or you’re looking at survey results for work, or you’re trying to decide if your A/B test really found a winner—pause for a second. Think about:
✅ The margin of error (both reported and real)
✅ The sources of potential bias (frame, nonresponse, measurement, specification)
✅ Trends rather than individual data points
✅ Whether the lead is outside the margin of error for the difference
✅ Who might be missing from the sample
✅ Whether respondents have reasons to lie
Being statistically savvy doesn’t mean being cynical—rather, it means being appropriately skeptical and making smarter decisions based on what the data can (and can’t) really tell you.
The Brexit Bottom Line
YouGov surveyed 4,772 people. They calculated a margin of error of ±1.4%. Furthermore, they did everything by the book. Nevertheless, they were still wrong by 3.8 percentage points—nearly triple their margin of error.
That’s not because they were bad at math. Rather, it’s because the math only captures one piece of the puzzle. The rest? That’s the messy, complicated, human reality of survey research.
Now go forth and interpret responsibly! Additionally, maybe share this with that friend who won’t shut up about that one poll showing their preferred candidate ahead. 😉
Key Takeaway: The margin of error tells you the minimum amount of uncertainty due to sampling randomness. However, in the real world, non-sampling errors (who you missed, how you asked, what you measured) usually contribute 2-3X more error than sampling alone. Brexit proved it. Similarly, the 2016 and 2020 U.S. elections proved it. Your A/B test might be proving it right now. Be skeptical. Be smart. Moreover, always, always account for Total Survey Error.
Reference List
Academic Sources on Total Survey Error
Groves, R. M., & Lyberg, L. (2010). Total survey error: Past, present, and future. Public Opinion Quarterly, 74(5), 849-879. https://doi.org/10.1093/poq/nfq065
- This is the foundational academic paper on Total Survey Error framework
Biemer, P. P., & Lyberg, L. E. (2003). Introduction to Survey Quality. Hoboken, NJ: Wiley.
- Comprehensive textbook on survey quality and non-sampling errors
Shirani-Mehr, H., Rothschild, D., Goel, S., & Gelman, A. (2018). Disentangling bias and variance in election polls. Journal of the American Statistical Association, 113(522), 607-614. https://doi.org/10.1080/01621459.2018.1448823
- Empirical study finding that actual poll error is approximately twice the reported margin of error
Kotak, A., & Moore, D. A. (2022). Election polls are 95% confident but only 60% accurate. Judgment and Decision Making, 17(3), 586-610.
- Study showing polls would need margins of error at least twice their current width to achieve 95% accuracy
Brexit Polling Sources
British Polling Council. (2016, July 19). Performance of the polls in the EU referendum. Retrieved from https://www.britishpollingcouncil.org/performance-of-the-polls-in-the-eu-referendum/
- Official post-mortem analysis of Brexit polling accuracy
Clarke, H. D., Goodwin, M., & Whiteley, P. (2016, July 5). Leave was always in the lead: Why the polls got the referendum result wrong. LSE British Politics and Policy Blog. Retrieved from https://blogs.lse.ac.uk/politicsandpolicy/eu-referendum-polls/
- Academic analysis of Brexit polling errors, including house effects and mode differences
YouGov. (2016, June 28). The online polls were RIGHT, and other lessons from the referendum. Retrieved from https://yougov.co.uk/politics/articles/15815-online-polls-were-right
- YouGov’s own analysis of their Brexit polling performance
Curtice, J. (2016). A return to the pre-election polls. What UK Thinks: EU. Retrieved from https://www.whatukthinks.org/eu/opinion-polls/poll-of-polls/
- Aggregation and analysis of all Brexit referendum polls
Margin of Error Calculation Sources
American Association for Public Opinion Research (AAPOR). Margin of sampling error/credibility interval. Retrieved from https://aapor.org/wp-content/uploads/2023/01/Margin-of-Sampling-Error-508.pdf
- Official AAPOR guidance on calculating and interpreting margin of error
Pew Research Center. (2016, September 8). 5 key things to know about the margin of error in election polls. Retrieved from https://www.pewresearch.org/fact-tank/2016/09/08/understanding-the-margin-of-error-in-election-polls/
- Accessible explanation of margin of error for general audiences
Historical Polling Failures
2016 U.S. Election:
- AAPOR. (2017). An evaluation of 2016 election polls in the U.S. Ad Hoc Committee on 2016 Election Polling. American Association for Public Opinion Research.
2020 U.S. Election:
- AAPOR. (2021). An evaluation of 2020 election polls in the U.S. Task Force on 2020 Pre-Election Polling. American Association for Public Opinion Research.
Literary Digest (1936):
- Squire, P. (1988). Why the 1936 Literary Digest poll failed. Public Opinion Quarterly, 52(1), 125-133.